Water
Goal: To improve the quality of our water resources and increase water conservation.
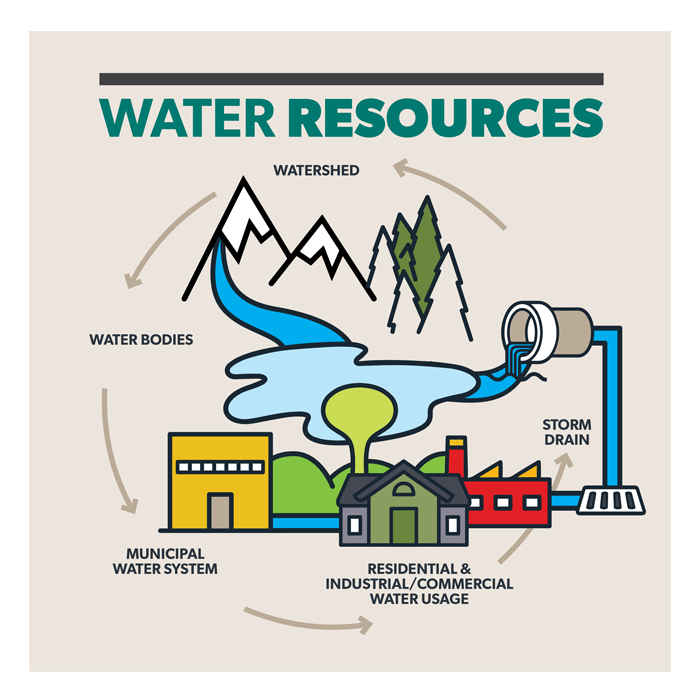
Sustaining our water resources includes understanding and effectively managing issues such as water conservation, water quality protection, watershed well-being, and storm and surface water management. When managed sustainably our watershed, river and municipal water system will support the health of citizens, maintain aquatic and terrestrial environments, enable a variety of beneficial ecological services, provide community recreation options and support a robust local economy.
What can you do?
- Replace any toilets on your property that use more than 6 litres per flush with a low flow toilet (and get a rebate!)
- Audit your water consumption using the Energy & Water Conservation Toolkit available free at Red Deer Public Library
- Capture rain water to use in your yard (and get a rebate!)
- Naturescape your yard using low-water plants and mulch (and get rebates!)
- Make sure only rain goes in the storm drain by Adopting a Storm Drain to protect our river and creeks
- Return unused medications to the pharmacy and properly drain your swimming pool and hot tub
Check out our progress towards achieving our water quality and conservation goals below.