Community Design

Goal: To plan and build a well-connected, sustainable community that contributes to a quality of life for residents.
EMP Community Design Header

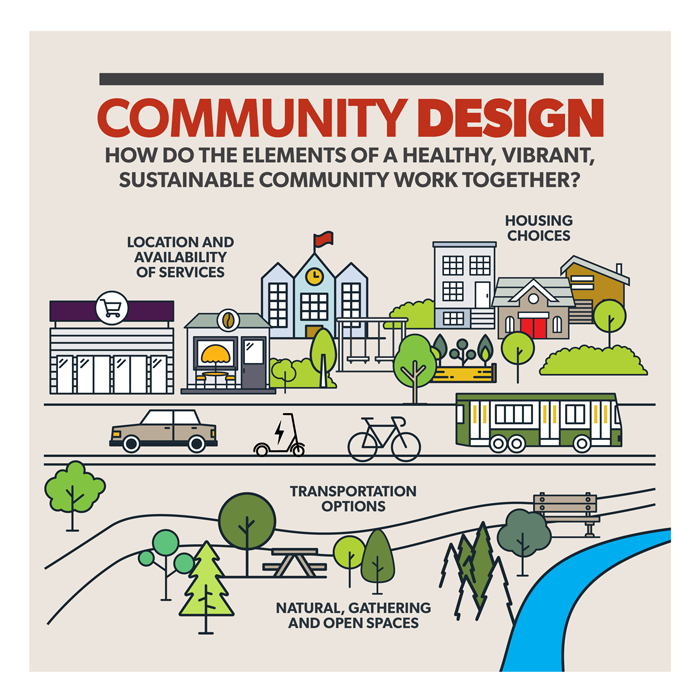
The design and development of communities has a significant impact on the health of the region's natural systems. Development patterns also influence decisions citizens make on how to travel around a city. The combined impacts of individual citizens can have implications for air quality, water quality and human health. The design of the city also affects energy use including residential, commercial and industrial building needs and transportation requirements.

What can you do?

  • Get around using active transportation: cycle or walk
  • Support neighbourhood gardens, food forests and garden plots
  • Ride Transit even one trip a week 

Check out our progress towards achieving our goal of a well-connected, sustainable community in the links below.

Length of bicycle and pedestrian routes

Length of Bicycle and Pedestrian Routes

Measuring the length of all bicycle and pedestrian routes per hectare of urban development in metres per hectare. Urban development is calculated as the total amount of land within the city that has an urban-type zoning plus roads.

2022 Results
  Baseline (2018) 2022 Result Target (2035)
Length of bicycle & pedestrian routes (m/ha) 125.3 127.6 148.4
Historical results
  Length of bicycle & pedestrian routes (metres/hectare)
2022 127.6
2021 127.0
2020 126.1
2019 125.6
2018 125.3
Fuel consumption

Fuel Consumption

Measuring the total gasoline and diesel consumed annually in Red Deer, based on total sales from commercial fuel stations. Measured in litres per capita.

2022 Results
  Baseline (2009) 2022 Result Target (2035)
Vehicle fuel consumed (litres per capita) 1257 1085 1069
Historical results
  Vehicle fuel consumed (litres per capita)
2022 1085
2021 1086
2020 1110
2019 1289
2018 1415
2017 1418
2016 1424
2015 1344
2014 1232
2013 1190
2012 1203
2011 1219
2010 1215
2009 1257
Emissions from transportation

Emissions from Transportation

Measuring the emissions attributed to transportation in Red Deer in tonnes of carbon dioxide equivalent* per person.

2022 Results
  Baseline (2017) 2022 Result Target (2035): not to exceed
Emissions from transportation (tCO2e/person) 3.55   2.68 3.55
Historical results
  Emissions from transportation (tCO2e/person)
2022 2.68
2021 2.70
2020 2.76 
2019 3.20
2018 3.48
2017 3.55

* tonnes of carbon dioxide equivalent (tCO2e): there are several greenhouse gases, all of which have a different impact. For example, one tonne of methane has the same impact as 28 tonnes of carbon dioxide. Rather than listing all the different greenhouse gases separately, we convert them all to carbon dioxide equivalent to come up with one total number. 

Transit ridership

Transit Ridership

Annual transit trips per capita taken on Red Deer Transit, including regional services.

2022 Results
  Baseline (2016) 2022 Result Target (2035)
Transit trips per capita 27 12.5 31
Historical results
  Transit trips per capita
2022 12.5
2021 9.5
2020 11.2
2019 26
2018 no report
2017 no report
2016 27
Land development footprint

Land Development Footprint

Measuring urban development in metres squared per capita. Urban development is calculated as the total amount of land within the city that has an urban-type zoning (and is used – or will imminently be used – for urban uses) plus the amount of land dedicated to roads divided by the current city population.

2022 Results
  Baseline (2011) 2022 Result Target (2035)
Urban development (m2/capita) 740 690 563
Historical results
  Urban development (m2/capita)
2022 690
2021 724
2020 722
2019 721
2018 729
2017 no report
2016 700
2015 693
2014 717
2013 697
2012 no report
2011 740
Community garden plots

Community Garden Plots

The number of garden plots and the number of reported Red Deer residents who benefit from garden produce grown.

2022 Results
  Baseline (2017) 2022 Result Target (2035)
Number of garden plots 466 541 1029
Number of residents who benefit 1791 2067 4488
Historical results
  Garden plots Residents
2022 541 2067
2021 541 2035
2020 498 1962
2019 499 2139
2018 no report no report
2017 466 1791